Your network.
Visualized.
Managed.
Forget static PDF reports. Your network is a living map — isochrones, heatmaps, revenue predictions — updated continuously.
studies / year
countries covered
data points
of history
Click on a city.
Visualize its potential.
Explore catchment areas, population density, and commercial potential in real-time. Imagine this with your own data.
—
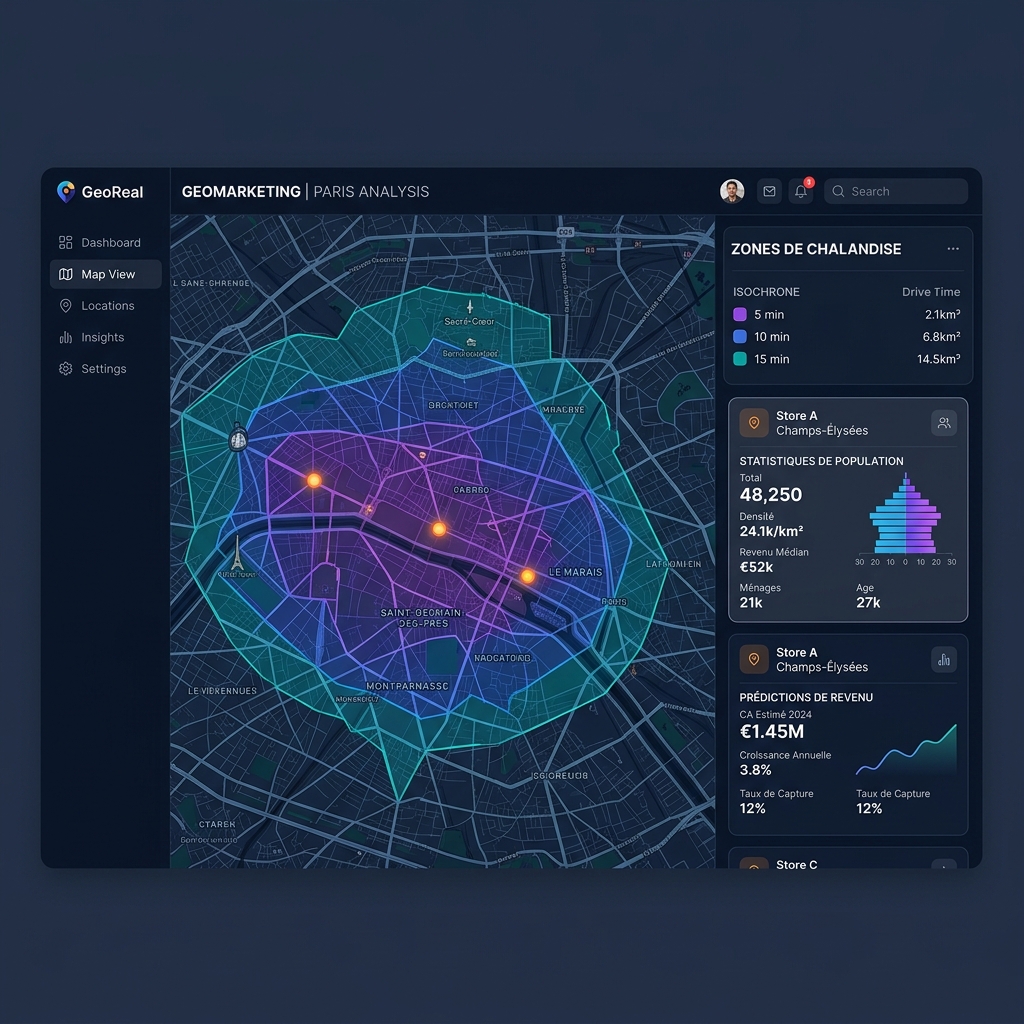
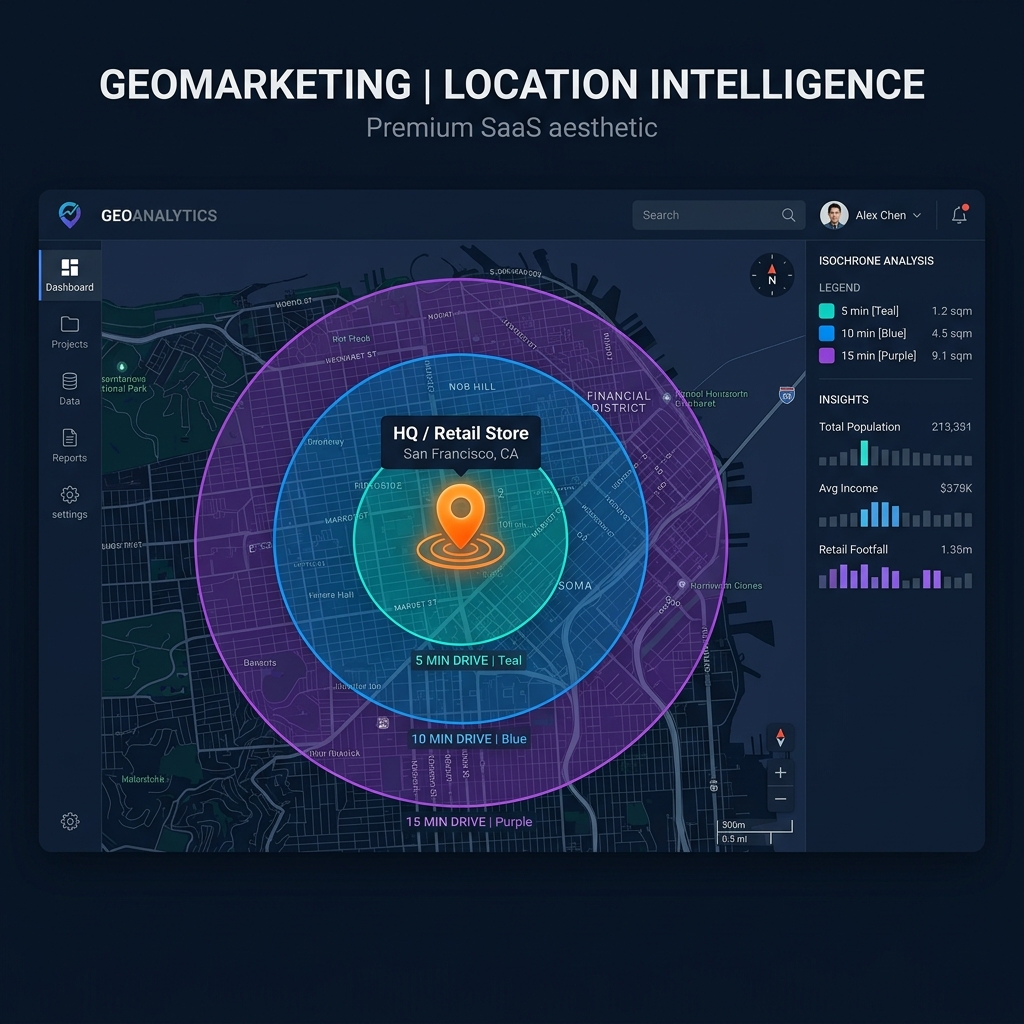
10 min catchment area
Demonstration data
Convinced? Imagine this analysis on your own network.
Get my Personalized DemoEverything your expansion team needs
A platform designed by clients, for clients: simple and operational.
Dynamic Isochrones
Travel by car, walking, or public transport. Calculated in real-time with updated traffic data. Adjust parameters with one click.
- Modes: Car, Walking, Public Transport
- Customizable times (5, 10, 15, 20 min)
- Correlation with socio-demographic data
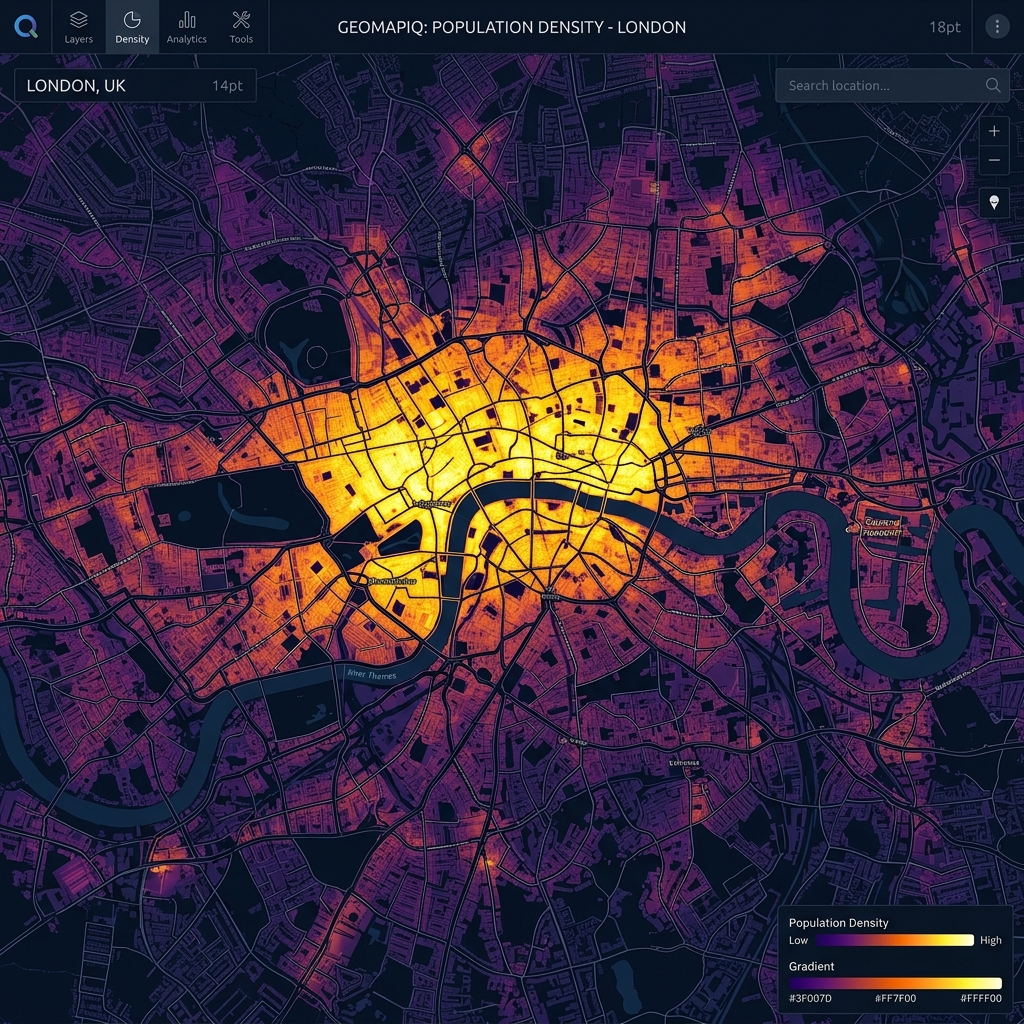
Potential Heatmaps
Visualize high-density zones of your target customers and identify untapped "white spaces".
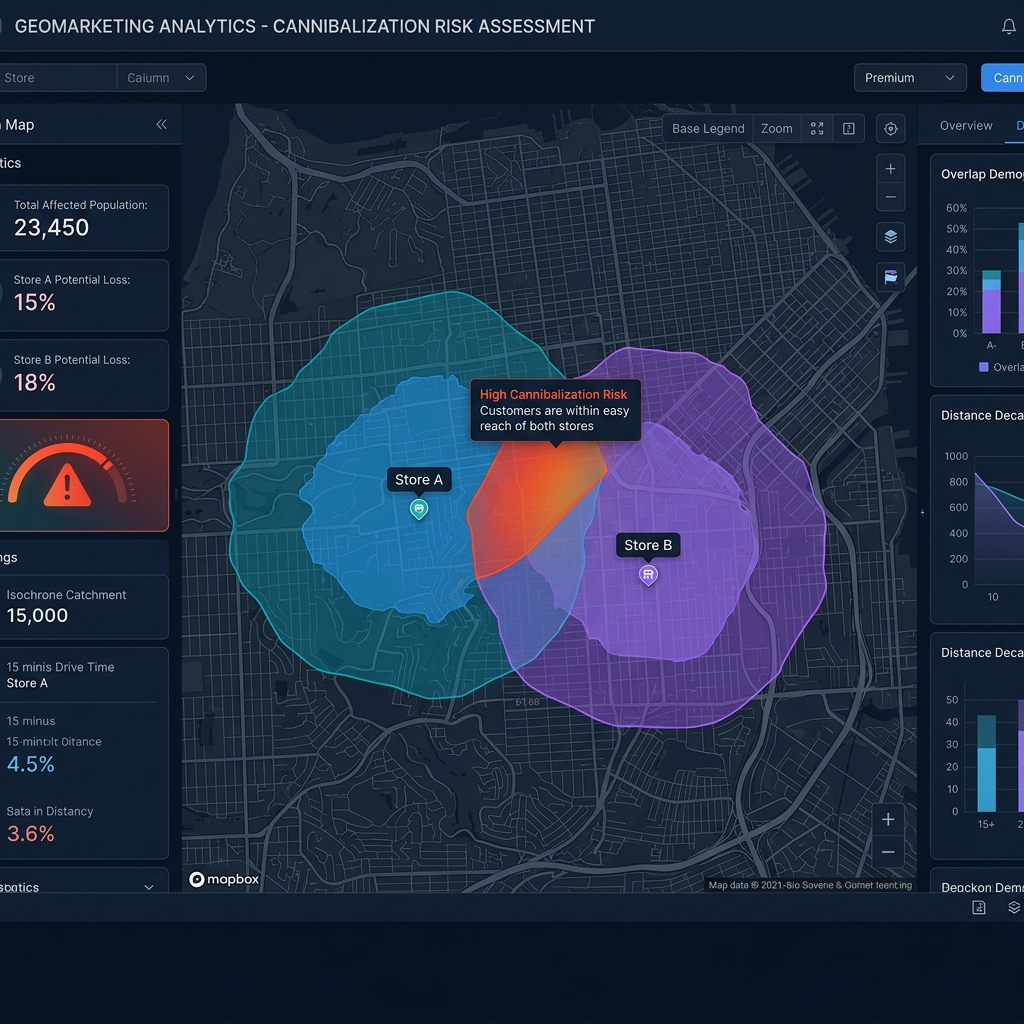
Cannibalization Analysis
Simulate the impact of a new opening on the sales of your adjacent locations before signing the lease.
Secure Private Data
Upload your loyalty customer files. Geographical visualization of your real client base.
Committee Exports
Customized presentation PDFs in one click, ready for your next expansion committee.
Team Collaboration
Shared spaces with your development teams, franchisees, and developers.
Your study no longer collects dust in a drawer
Every ordered study includes permanent access to your SAD Interactive space.
Classic PDF Report
- Data frozen at the date of study
- No filters or search capabilities
- Email requests for every update
- No secure sharing
- Static non-interactive charts
- Impossible to cross-reference with your data
Living Dashboard
- Continuously updated data
- Dynamic filters by area, period, KPI
- 24/7 access — no waiting
- Secure collaborative spaces
- Interactive maps and charts
- Import of your proprietary data
Beyond off-the-shelf mapping tools.
Expert data, not a blank canvas.
Consumer SaaS tools are for teams working autonomously with raw data. SAD Interactive is the platform for delivering your SAD Marketing studies: your data is already pre-loaded, analyzed, and contextualized by our experts.
Every ordered study includes access to your SAD Interactive space. Your investment isn't limited to a PDF — you get a living dashboard that evolves with your network.
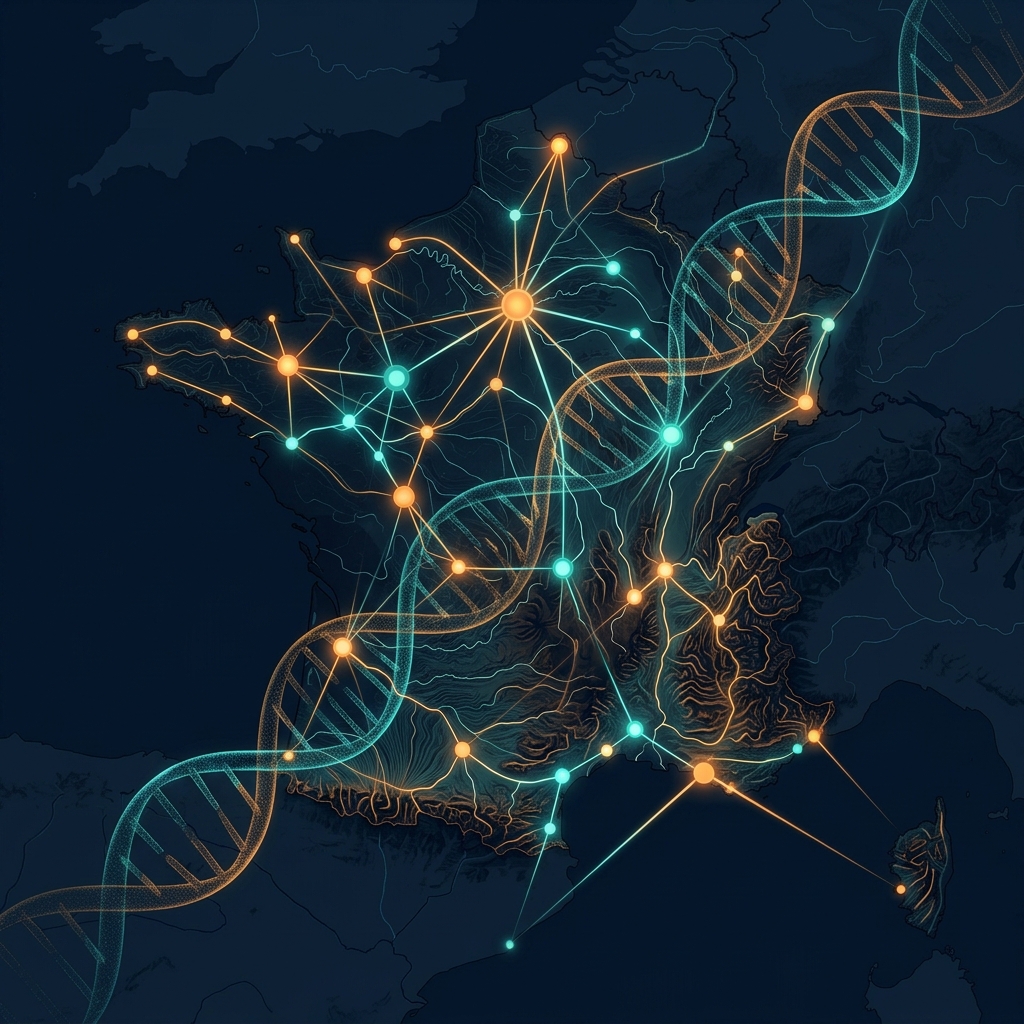
SAD Marketing × University of Burgundy-Franche-Comté
We have created a public/private laboratory with the FEMTO-ST Institute (UMR 6174), one of the most active in AI in France. The research work is focused on spatial predictions.
If our predictive technology is robust enough to anticipate emergency interventions and save lives (PredictOps × SDIS 25), it is undoubtedly enough to predict retail location revenue.
"The algorithms developed with SAD Marketing reach unprecedented levels of precision in spatial prediction, thanks to the integration of heterogeneous data sources and our machine learning expertise."
Want to see your network on the map?
Our teams can prepare a personalized demo access with your data within 48h.
SAD Interactive FAQ
Tout ce que vous devez savoir sur nos solutions.