
Your stores are losing revenue somewhere. We show you where, why, and what to do.
Your receipts and loyalty file, compared with the potential of each neighbourhood against the competition in place. Then field visits, your reviews and your lost customers to understand the gap. And a costed action plan to close it.
From €1,500 per store, excl. VAT · The demo's interface is in French
Three questions, three answers in euros .
A dashboard tells you how much each store sells. An audit tells you how much it should sell, where the gap is, and what explains it.
How much, and where
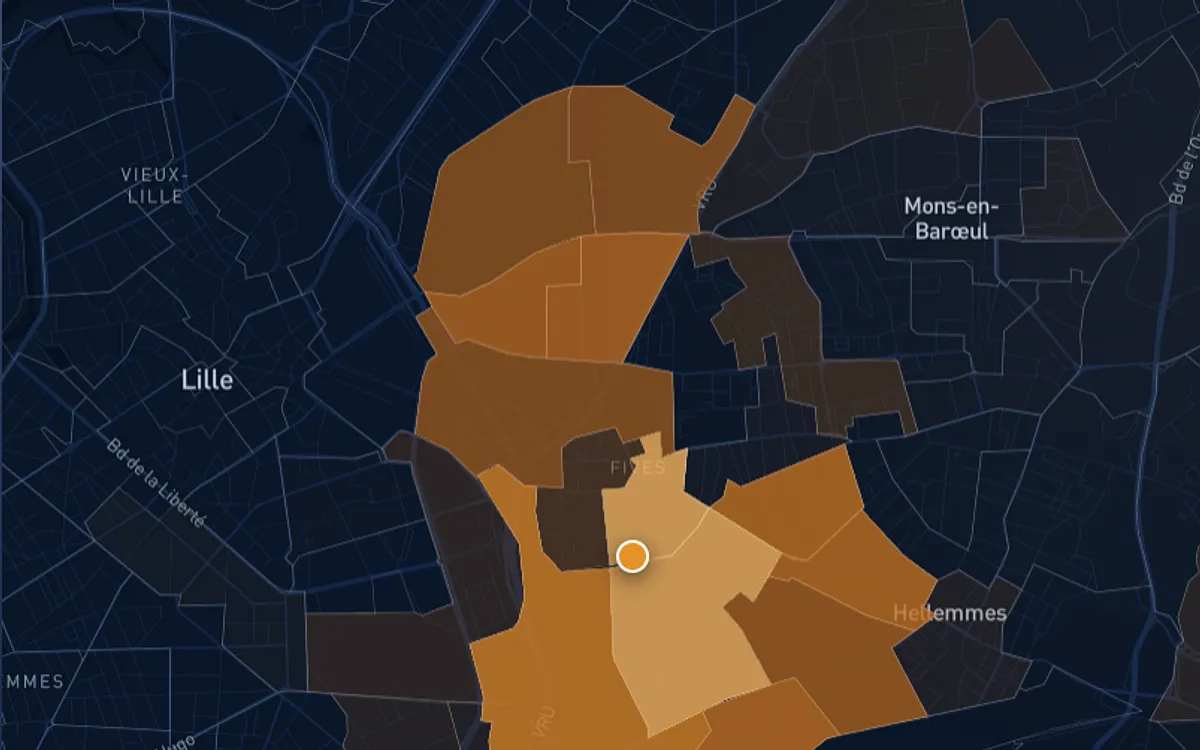
The gap between each store's revenue and what its catchment allows against the competition actually in place, in euros and mapped neighbourhood by neighbourhood. Your stores ranked by missing revenue, not by revenue.
Why
A competitor opening, an urban barrier, a checkout queue, a department falling behind. We cross your figures with field visits, your reviews and what your lost customers say — your loyalty file lets us find them.
What to do
An action plan ranked by recoverable revenue: for each lever, the finding, the action, the cost, the timing, the expected gain and how we will measure that it worked.
The page your board reads .
The report runs to some thirty pages: maps, neighbourhoods, lost customers, competition, field notes, verbatims. But it opens on one page: what the store loses, where, and what will bring it back.
Opposite, the summary of our demo, on a fictitious chain in the Lille metropolitan area. Simulated figures; real neighbourhoods and competitors.
70% of the gap in 6 neighbourhoods within 5 minutes.
815 lost customers in 12 months, 78% of them around a discounter opened in March 2025.
Prices versus the discounter, Saturday queues, a weak fresh department, an area cut off by railway tracks.
Full action plan: €474k recoverable within 12 months, across 5 costed levers.
Data first, then the field .
Figures tell you where. The field and your customers tell you why. An audit that stops at maps leaves half the work undone.
- 1
Your figures
Receipts, geocoded loyalty file, revenue by store and by department.
- 2
The potential
Market size of each neighbourhood, competition in place, a model calibrated on your network.
- 3
The field
Visits to the store and its competitors, on weekdays and on Saturday.
- 4
Customers' voice
Reviews and complaints classified by AI then read by a consultant; interviews with lost customers.
- 5
The plan
Costed levers, ranked, each with its tracking indicator.
From one store to the whole network .
Express audit
From your data only, remotely: missing-revenue map, penetration by neighbourhood, lost customers and the three priority levers.
Full audit
The express audit plus field visit, competition and review analysis, interviews with lost customers and non-customers, and the costed action plan.
Network mapping
All your stores ranked by gap to potential, then the full audit of the three to five stores carrying most of the gap.
Monitoring
Monthly update of penetration and lost customers on SAD Interactive, with an alert when a neighbourhood drops.
What we need .
- →A customer file export: an address or postcode, purchase date and amount, over 12 to 24 months. A pseudonymised ID is enough, no names.
- →Revenue by store, and by department if possible.
- →No customer file? Postcode capture at the till or an exit survey over a few days allow a coarser audit.
- Data processing agreement under article 28 GDPR, signed before any file is exchanged (our standard agreement, in French).
- Pseudonymised data: we do not need your customers' names or contact details.
- Hosted in the EU, deleted at the end of the engagement.
- Statistical confidentiality: no result reported for fewer than 5 customers in a neighbourhood.
Store performance audit: frequently asked questions
Everything you need to know about our solutions.
What is a store performance audit?
How is it different from our BI tools?
What data do you need?
Do you work outside France?
What about GDPR?
How much revenue can be recovered?
Find out where your stores lose revenue
Tell us how many stores you have and what data you keep (receipts, loyalty file, postcodes): we reply within 24 hours with what an audit can establish for you, and at what cost.